Advanced Kubernetes Deployment on an NVIDIA GPUs Cluster: NGINX Ingress Controler, Local Storage, and Prometheus Monitoring
- Install and configure an Ingress controller: applying to NGINX Ingress Controller
- Install and configure a storage system: applying to Rancher Local Path Provisioner
- Install and configure a cluster monitoring solution: applying to Prometheus
- Conclusion
The goal of this tutorial is to complete the installation of a Kubernetes (k8s) cluster equipped with GPU cards, which is detailed in a previous blog post: Guide to Deploying NVIDIA GPUs on Kubernetes.
To ensure a well-functioning Kubernetes cluster, it must include at least the following essential features, which were not covered previously:
- configure an Ingress controller to link a URL to a Kubernetes service,
- set up a storage system for pod data persistence,
- implement a monitoring system for cluster data.
The specific requirements of the Kubernetes cluster I had to set up required custom configurations, which I present below:
- a reverse proxy upstream of the Kubernetes cluster for SSL certificate management, offloading this task from the Ingress Controller,
- storage exclusively on local disks,
- release of the GPU resource for pods not using it.
Based on these requirements, I was able to choose the extensions to install on the cluster:
- NGINX Ingress Controler: https://github.com/kubernetes/ingress-nginx,
- Rancher Local Path Provisioner: https://github.com/rancher/local-path-provisioner,
- Prometheus: https://github.com/prometheus-operator/kube-prometheus.
Versions of the used components/tools:
- containerd: 1.7.20,
- runC: 1.1.13,
- kubeadm, kubelet, kubectl: 1.30.4,
- helm: 3.15.4,
- Cilium: 1.16.0,
- Kubenetes: 1.30.4,
- NGINX Ingress Controler: 4.11.2 (Helm chart), 1.11.2 (NGINX),
- Rancher Local Path Provisioner : 0.0.28,
- Prometheus Operator: 26.0.0 (Helm chart), 3.0.0 (Prometheus).
We will detail the installation and configuration of these extensions in the following three sections. All installations will be done using the Helm tool.
Install and configure an Ingress controller: applying to NGINX Ingress Controller
The role of an Ingress controller is to manage external access to the services of a Kubernetes cluster. A system of rules allows linking URLs to a Kubernetes service. The Ingress controller then operates a reverse proxy to implement these rules (for example: NGINX).
There are many Ingress controllers, as shown on the official Kubernetes page: https://kubernetes.io/docs/concepts/services-networking/ingress-controllers. My choice of NGINX was mainly motivated by the fact that I have been using it for a long time. Official page of the NGINX Ingress Controller: https://github.com/kubernetes/ingress-nginx.
- Add the official Ingress-NGINX Helm repository to the list of available Helm repositories on your system.
1
$ helm repo add ingress-nginx https://kubernetes.github.io/ingress-nginx
- List all available versions of the Helm chart for Ingress-NGINX.
1
2
3
4
5
6
7
$ helm search repo ingress-nginx -l
NAME                       	CHART VERSION	APP VERSION	DESCRIPTION
ingress-nginx/ingress-nginx	4.11.2       	1.11.2     	Ingress controller for Kubernetes using NGINX a...
ingress-nginx/ingress-nginx	4.11.1       	1.11.1     	Ingress controller for Kubernetes using NGINX a...
ingress-nginx/ingress-nginx	4.11.0       	1.11.0     	Ingress controller for Kubernetes using NGINX a...
ingress-nginx/ingress-nginx	4.10.6       	1.10.6     	Ingress controller for Kubernetes using NGINX a...
...
- Install the Ingress-NGINX controller in your Kubernetes cluster within a namespace called
ingress-nginx.
1
2
3
4
5
6
7
8
9
10
11
12
13
14
15
16
17
18
19
20
21
22
23
24
25
26
27
28
29
30
31
32
33
34
35
36
37
38
39
40
41
$ helm upgrade --install ingress-nginx ingress-nginx --namespace ingress-nginx --create-namespace --version 4.11.2
The ingress-nginx controller has been installed.
It may take a few minutes for the load balancer IP to be available.
You can watch the status by running 'kubectl get service --namespace ingress-nginx ingress-nginx-controller --output wide --watch'

An example Ingress that makes use of the controller:
  apiVersion: networking.k8s.io/v1
  kind: Ingress
  metadata:
    name: example
    namespace: foo
  spec:
    ingressClassName: nginx
    rules:
      - host: www.example.com
        http:
          paths:
            - pathType: Prefix
              backend:
                service:
                  name: exampleService
                  port:
                    number: 80
              path: /
    # This section is only required if TLS is to be enabled for the Ingress
    tls:
      - hosts:
        - www.example.com
        secretName: example-tls

If TLS is enabled for the Ingress, a Secret containing the certificate and key must also be provided:

  apiVersion: v1
  kind: Secret
  metadata:
    name: example-tls
    namespace: foo
  data:
    tls.crt: <base64 encoded cert>
    tls.key: <base64 encoded key>
  type: kubernetes.io/tls
After installation, setup instructions are provided for using this Ingress controller. Note that if you do not specify the --version option, the latest version will be used. Check this table https://github.com/kubernetes/ingress-nginx?tab=readme-ov-file#changelog to ensure that the version of the Ingress controller based on NGINX is compatible with your Kubernetes version.
However, the installation does not take into account the specificities of the cluster I want to set up, namely that the cluster is behind a reverse proxy managed by the institution hosting the servers. To configure a Helm-based deployment, parameters need to be adjusted. Explanations for these settings can be found in the Ingress-NGINX documentation: https://kubernetes.github.io/ingress-nginx/user-guide/nginx-configuration/configmap/.
use-forwarded-headers: set toTrueif NGINX is behind a reverse proxy (documentation).proxy-real-ip-cidr: to specify a list of IP addresses of the reverse proxy (documentation).
These parameters must be specified in a YAML file (values.yaml) as shown below.
1
2
3
4
controller:
  config:
    use-forwarded-headers: true
    proxy-real-ip-cidr: 192.140.161.110,192.140.161.111
- Update the Ingress-NGINX controller configuration by running the command below.
1
$ helm upgrade ingress-nginx ingress-nginx --namespace ingress-nginx -f values.yaml
The changes are applied to the NGINX server and can be seen in the /etc/nginx/nginx.conf file of the deployed Pod.
- To view the content, you can run the following commands.
1
2
3
4
5
6
7
8
9
10
11
12
13
14
15
16
# Pour récupérer le Pod associé au déploiement du package helm.
$ kubectl get pods -n ingress-nginx
NAME                                       READY   STATUS    RESTARTS       AGE
ingress-nginx-controller-55dd9c5f4-f4rkm   1/1     Running   2 (129d ago)   168d

# Pour afficher le contenu du fichier /etc/nginx/nginx.conf
$ kubectl exec -it ingress-nginx-controller-55dd9c5f4-f4rkm -n ingress-nginx -- more /etc/nginx/nginx.conf
...
        real_ip_header      X-Forwarded-For;

        real_ip_recursive   on;

        set_real_ip_from    192.140.161.110;

        set_real_ip_from    192.140.161.111;
...
- Finally, it is necessary to modify the deployed Ingress-NGINX controller service to expose it outside the cluster. All IP addresses that can be defined as entry points must be specified.
1
$ kubectl patch svc ingress-nginx-controller -n ingress-nginx -p '{"spec": {"type": "LoadBalancer", "externalIPs":["192.140.161.103", "192.140.161.104"]}}'
At this stage, the Ingress-NGINX controller is configured behind a reverse proxy.
Install and configure a storage system: applying to Rancher Local Path Provisioner
Rancher Local Path Provisioner provides storage (via a PersistentVolumes object) for Pods. Its main feature is storing data on local disks available on Kubernetes cluster nodes. There are more robust solutions based on centralized network storage (NFS, Ceph, etc.), but the constraints of my cluster setup require this type of storage. We will specify where the storage will take place on each node and set this storage class as the default for all volume requests.
- Install local storage.
1
$ kubectl apply -f https://raw.githubusercontent.com/rancher/local-path-provisioner/v0.0.28/deploy/local-path-storage.yaml
- Edit the associated
ConfigMapobject (created during installation) to specify the locations where local storage will be available. In this case, two nodes are available, namedk8s-gpu-node1andk8s-gpu-node2. Thepathskey is an array containing absolute path values.
1
2
3
4
5
6
7
8
9
10
11
12
13
14
15
16
17
18
19
20
21
22
23
24
25
26
27
28
29
30
31
32
33
34
35
36
37
38
39
40
41
42
43
44
45
46
47
48
$ kubectl edit configmap local-path-config -n local-path-storage
# Please edit the object below. Lines beginning with a '#' will be ignored,
# and an empty file will abort the edit. If an error occurs while saving this file will be
# reopened with the relevant failures.
#
apiVersion: v1
data:
  config.json: |-
    {
            "nodePathMap":[
            {
                    "node":"DEFAULT_PATH_FOR_NON_LISTED_NODES",
                    "paths":["/opt/local-path-provisioner"]
            },
            {
                    "node":"k8s-gpu-node1",
                    "paths":["/storage1"]
            },
            {
                    "node":"k8s-gpu-node2",
                    "paths":["/storage1","/storage2"]
            }
            ]
    }
  helperPod.yaml: |-
    apiVersion: v1
    kind: Pod
    metadata:
      name: helper-pod
    spec:
      priorityClassName: system-node-critical
      tolerations:
        - key: node.kubernetes.io/disk-pressure
          operator: Exists
          effect: NoSchedule
      containers:
      - name: helper-pod
        image: busybox
        imagePullPolicy: IfNotPresent
  setup: |-
    #!/bin/sh
    set -eu
    mkdir -m 0777 -p "$VOL_DIR"
  teardown: |-
    #!/bin/sh
    set -eu
    rm -rf "$VOL_DIR"
...
Saving the changes triggers an update of this storage. When a PersistentVolume object is created, it will be stored in one of the paths defined in the configuration.
- To use this type of storage without having to specify it, it must be set as the default storage. To apply this change, the
StorageClassobject created during installation must be modified.
1
$ kubectl patch storageclass local-path -p '{"metadata": {"annotations":{"storageclass.kubernetes.io/is-default-class":"true"}}}'
From now on, any new PersistentVolume object will be stored locally based on the node where the request is made.
Install and configure a cluster monitoring solution: applying to Prometheus
Prometheus is a monitoring tool that allows collecting, storing, and analyzing real-time metrics from infrastructure or applications. When deployed on a Kubernetes cluster, it enables monitoring of resource consumption. An example use case that will interest us is tracking the usage of critical resources such as the GPU, where it will be possible to identify Pods that have this type of resource but are not using it.

The installation of Prometheus will be done through the Prometheus Operator.
- Add the Helm repository for the Prometheus project.
1
$ helm repo add prometheus-community https://prometheus-community.github.io/helm-charts
- Install the Helm chart
prometheus-community/prometheusnamedprometheusand located in themetricsnamespace.
1
2
3
4
5
6
7
8
9
10
11
12
13
14
15
16
17
18
19
20
21
22
23
24
25
26
27
28
29
30
31
32
33
34
35
36
37
38
39
40
41
42
43
44
45
46
$ helm install prometheus prometheus-community/prometheus --create-namespace --namespace metrics --version 26.0.0

NAME: prometheus
LAST DEPLOYED: Wed Dec  4 06:25:15 2024
NAMESPACE: metrics
STATUS: deployed
REVISION: 1
TEST SUITE: None
NOTES:
The Prometheus server can be accessed via port 80 on the following DNS name from within your cluster:
prometheus-server.metrics.svc.cluster.local


Get the Prometheus server URL by running these commands in the same shell:
  export POD_NAME=$(kubectl get pods --namespace metrics -l "app.kubernetes.io/name=prometheus,app.kubernetes.io/instance=prometheus" -o jsonpath="{.items[0].metadata.name}")
  kubectl --namespace metrics port-forward $POD_NAME 9090


The Prometheus alertmanager can be accessed via port 9093 on the following DNS name from within your cluster:
prometheus-alertmanager.metrics.svc.cluster.local


Get the Alertmanager URL by running these commands in the same shell:
  export POD_NAME=$(kubectl get pods --namespace metrics -l "app.kubernetes.io/name=alertmanager,app.kubernetes.io/instance=prometheus" -o jsonpath="{.items[0].metadata.name}")
  kubectl --namespace metrics port-forward $POD_NAME 9093
#################################################################################
######   WARNING: Pod Security Policy has been disabled by default since    #####
######            it deprecated after k8s 1.25+. use                        #####
######            (index .Values "prometheus-node-exporter" "rbac"          #####
###### .          "pspEnabled") with (index .Values                         #####
######            "prometheus-node-exporter" "rbac" "pspAnnotations")       #####
######            in case you still need it.                                #####
#################################################################################


The Prometheus PushGateway can be accessed via port 9091 on the following DNS name from within your cluster:
prometheus-prometheus-pushgateway.metrics.svc.cluster.local


Get the PushGateway URL by running these commands in the same shell:
  export POD_NAME=$(kubectl get pods --namespace metrics -l "app=prometheus-pushgateway,component=pushgateway" -o jsonpath="{.items[0].metadata.name}")
  kubectl --namespace metrics port-forward $POD_NAME 9091

For more information on running Prometheus, visit:
https://prometheus.io/
➜  ~ kubectl get pods --namespace metrics -l "app.kubernetes.io/name=prometheus,app.kubernetes.io/instance=prometheus" -o jsonpath="{.items[0].metadata.name}"
- Expose the Prometheus server to access a web interface for testing queries.
1
2
3
4
$ export POD_NAME=$(kubectl get pods --namespace metrics -l "app.kubernetes.io/name=prometheus,app.kubernetes.io/instance=prometheus" -o jsonpath="{.items[0].metadata.name}")
$ kubectl --namespace metrics port-forward $POD_NAME 9090
Forwarding from 127.0.0.1:9090 -> 9090
Forwarding from [::1]:9090 -> 9090
Since the command using port-forward is blocking, make sure to open a new terminal to perform the next operations.
- To demonstrate GPU resource usage, Ollama will be deployed as we explained in the previous blog post.
1
2
3
4
5
6
7
8
9
10
11
12
13
14
15
16
17
18
$ helm repo add ollama-helm https://otwld.github.io/ollama-helm/
"ollama-helm" has been added to your repositories

$ kubectl create ns ollama
namespace/ollama created

$ helm install appli-ollama ollama-helm/ollama --namespace ollama --set ollama.gpu.enabled=true --set ollama.gpu.number=1 --set ollama.gpu.type=nvidia
NAME: appli-ollama
LAST DEPLOYED: Thu Jul 18 09:43:56 2024
NAMESPACE: ollama
STATUS: deployed
REVISION: 1
NOTES:
1. Get the application URL by running these commands:
  export POD_NAME=$(kubectl get pods --namespace ollama -l "app.kubernetes.io/name=ollama,app.kubernetes.io/instance=appli-ollama" -o jsonpath="{.items[0].metadata.name}")
  export CONTAINER_PORT=$(kubectl get pod --namespace ollama $POD_NAME -o jsonpath="{.spec.containers[0].ports[0].containerPort}")
  echo "Visit http://127.0.0.1:8080 to use your application"
  kubectl --namespace ollama port-forward $POD_NAME 8080:$CONTAINER_PORT
- Expose the Ollama server as indicated after its installation.
1
2
3
$ export POD_NAME=$(kubectl get pods --namespace ollama -l "app.kubernetes.io/name=ollama,app.kubernetes.io/instance=appli-ollama" -o jsonpath="{.items[0].metadata.name}")
$ export CONTAINER_PORT=$(kubectl get pod --namespace ollama $POD_NAME -o jsonpath="{.spec.containers[0].ports[0].containerPort}")
$ kubectl --namespace ollama port-forward $POD_NAME 8080:$CONTAINER_PORT
As mentioned earlier, since the command using port-forward is blocking, start a new terminal.
At this stage, you have access to:
- The web application provided by Prometheus accessible at http://127.0.0.1:9090,
-
The REST API provided by Ollama accessible at http://127.0.0.1:8080.
- From a terminal, download the LLM model
gemma:2b.
1
2
3
4
$ curl http://127.0.0.1:8080/api/pull -d '{
  "name": "gemma:2b"
}'
{"status":"pulling manifest"}
- Iterate several times the query to stress the GPU ressources. After checking, even though it is the same question, no cache is used.
1
2
3
4
5
6
7
8
for i in {1..100}; do
  curl http://127.0.0.1:8080/api/generate -d '{
    "model": "gemma:2b",
    "prompt": "Why is the sky blue?",
    "stream": false
  }';
  sleep 1
done
- Open a browser at the following address http://127.0.0.1:9090 and enter the following expression in the query box to display the five pods that consume the most GPU.
1
topk(5, avg(rate(DCGM_FI_PROF_GR_ENGINE_ACTIVE{pod!="", container!=""}[5m])) by (pod))
The result obtained is similar to the following screenshot.
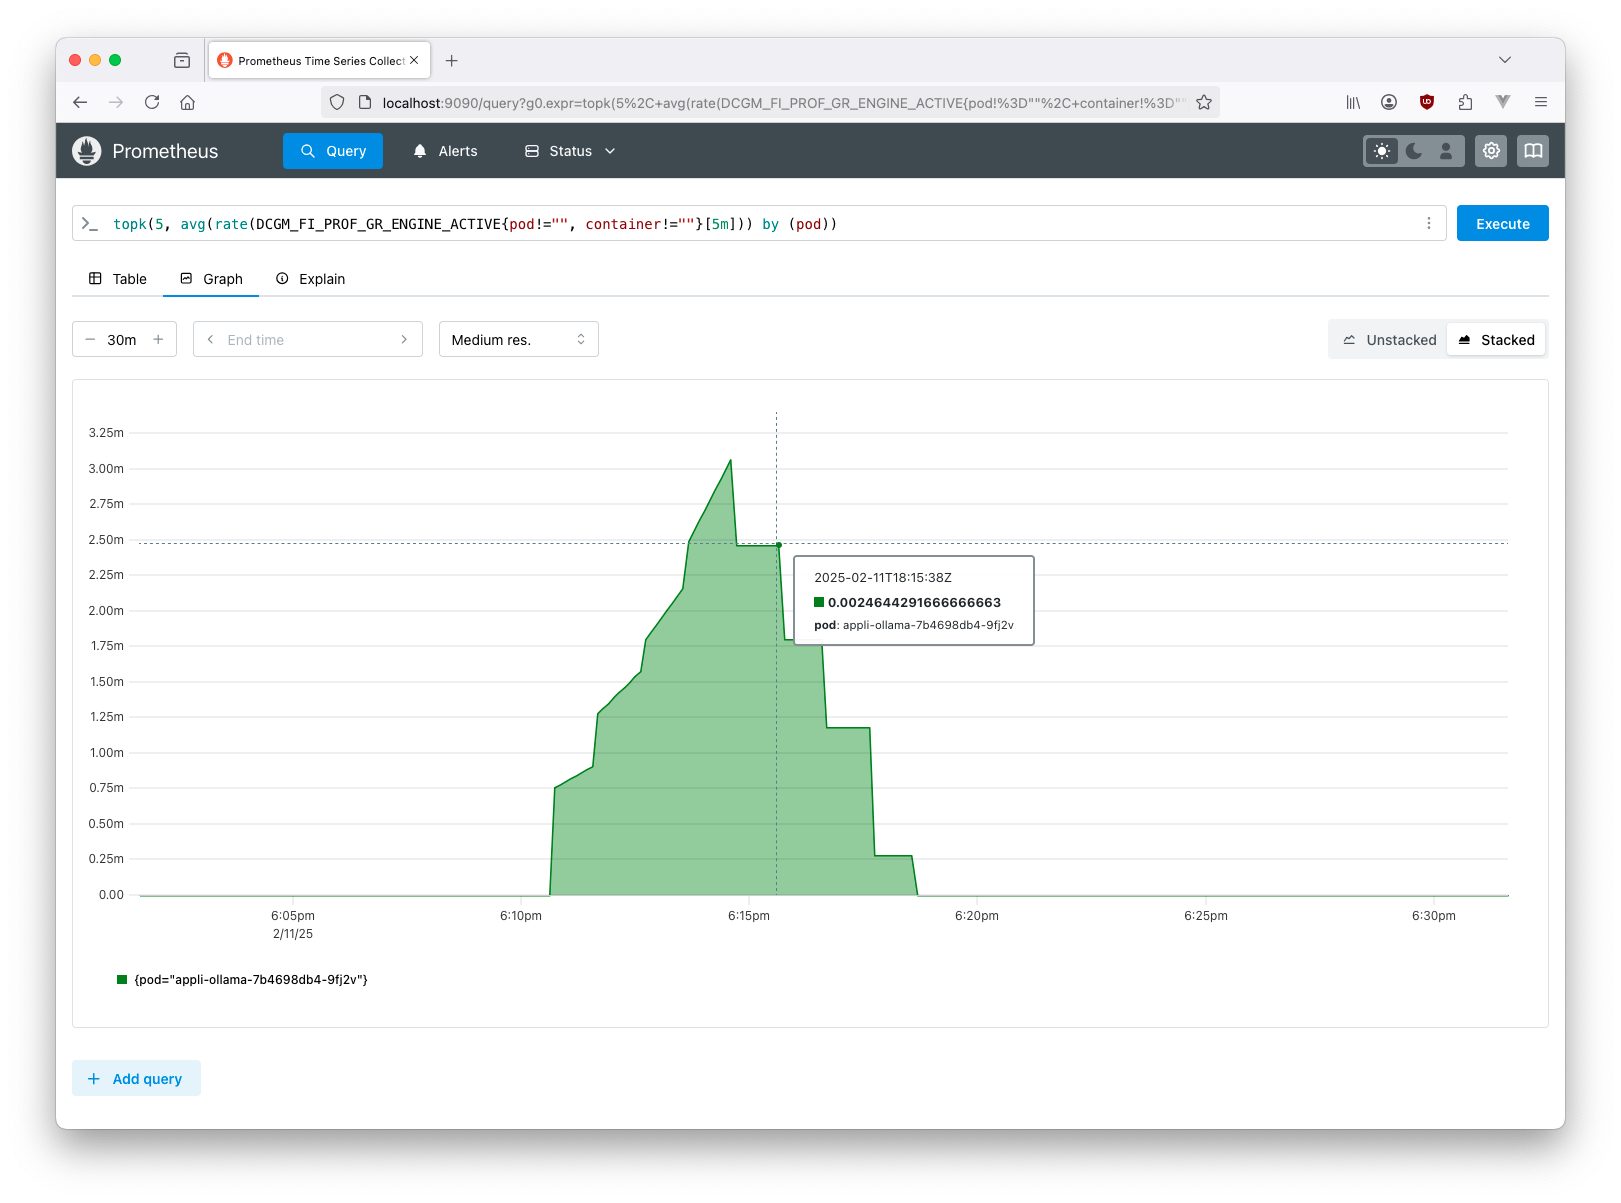
GPU usage increases over five minutes, which is roughly the duration of the previous command execution. Once the execution is complete, it is observed that the GPU is no longer being used.
It would be perfectly possible to use a Python script that queries Prometheus.
Conclusion
This blog post covered:
- the configuration of the NGINX Ingress Controller,
- the configuration of the Rancher Local Path Provisioner storage system,
- the configuration of the Prometheus cluster data monitoring system.
With the previous post and this one, you should now have a complete Kubernetes cluster to deploy applications.
There are still many things to explore, such as running a program that stops Pods not using the critical GPU resource. We will detail this example and many other interesting things in a future post dedicated to setting up a remote development platform based on Onyxia.
Je suis Mickaël BARON Ingénieur de Recherche en Informatique à l'ISAE-ENSMA et membre du laboratoire LIAS le jour
Veilleur Technologique la nuit
#Java #Container #VueJS #Services #WebSemantic

Derniers articles et billets
Vous pouvez laisser un commentaire en utilisant les Github Issues.